When engineering teams pitch annotation tooling to finance, they usually quote the hourly annotator rate and a frame count. The real cost picture is two or three times that number once you account for the elements that don't make it into a simple quote.
Understanding the full cost model is important not because it makes the case harder to approve, but because it shows where a pre-labeling investment creates the most leverage. An hour saved in QA rework is worth more than an hour saved in initial labeling, because rework hours occur later in the pipeline when the downstream cost of delay is higher.
The four components of annotation cost
Raw labeling hours are only the first line item. The complete model has four components that interact with each other.
The first is initial labeling time: the hours annotators spend drawing boxes, polygons, or keypoints on raw frames. This is the most visible cost and the one pre-labeling addresses most directly. At two minutes per frame with five objects, and a $20 per hour annotator rate, initial labeling on a 50,000-frame dataset runs to roughly $33,000 before any overhead.
The second is annotator ramp and training. A new annotator on a specialized domain, medical imaging or automotive lidar, doesn't produce reliable labels on day one. Ramp time for a new annotator on a moderately complex domain runs two to four weeks of reduced throughput. If you're scaling annotator headcount for a large batch, the ramp cost is significant and often invisible in project budgets.
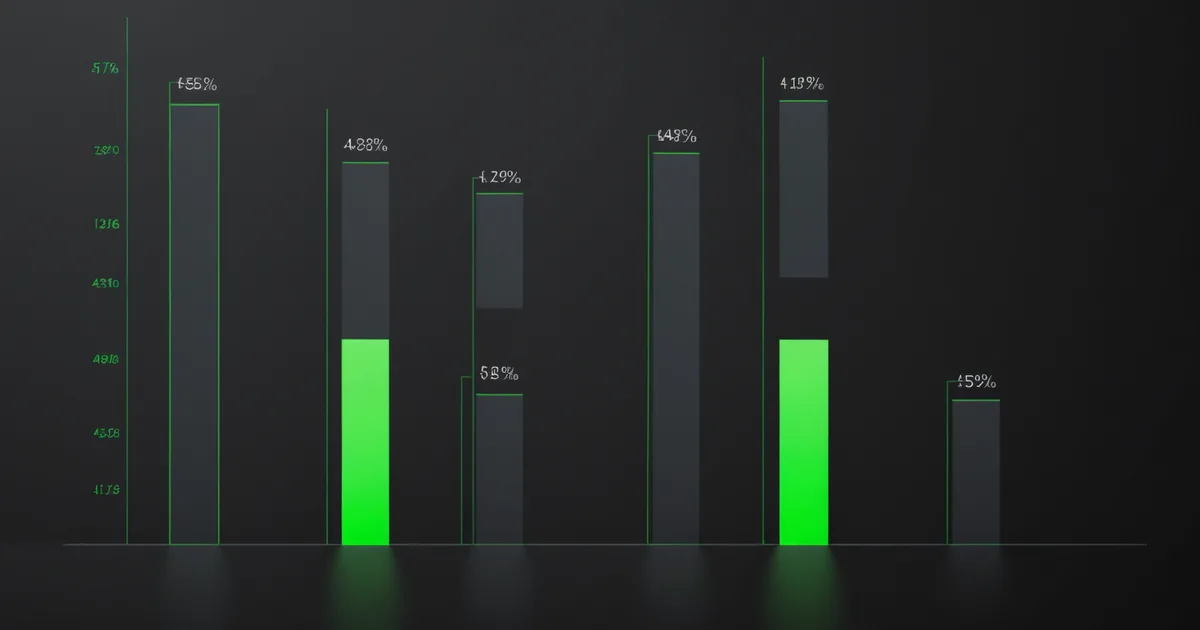
The third is QA cycles. A standard annotation workflow runs at least one QA pass, where a supervisor reviews a sample of completed labels and routes low-quality work back for reannotation. The reannotation rate on from-scratch annotation typically runs 8 to 15% of frames. At that rate on a 50,000-frame dataset, you're adding 4,000 to 7,500 additional label events to the budget before the dataset is clean enough for training.
The fourth is pipeline overhead: the time spent importing frames, exporting labeled data, converting formats, and coordinating annotator assignments. This is often absorbed into engineering time rather than annotation budgets, but it's real cost that scales with dataset volume.
Where pre-labeling creates leverage
Pre-labeling's most direct impact is on initial labeling time, cutting the per-frame correction time from roughly two minutes to 35-45 seconds on well-supported domains. But the secondary impact on QA rework is proportionally larger. When annotators start from an AI-generated box rather than a blank canvas, the error profile changes. They're nudging accurate boxes rather than misplacing drawn boxes. The reannotation rate on pre-labeled workflows runs 3 to 6%, roughly half the from-scratch rate. At 50,000 frames, that difference is 2,500 to 4,500 fewer reannotation events, which is a meaningful reduction in total project time even before the initial labeling savings.
Building the ROI calculation
The calculation structure that works across dataset types starts with your current total annotation cost per frame, including initial labeling plus proportional QA and rework hours. Apply your domain's expected pre-labeling accuracy, 91% as a baseline for general detection, to estimate the correction-only time. Compute the reduced QA rate under a correction workflow. Sum the deltas and compare against the platform cost per frame to get the net savings per frame. Multiply by your annual volume to get the annual ROI figure that justifies the tooling investment.
Comparing tool costs against actual savings
Annotation tooling costs are typically quoted as per-label rates or monthly platform fees. Evaluating these against savings requires converting everything to the same unit. For a per-label pricing model, the comparison is direct: if the tool costs $0.15 per label and your from-scratch annotator cost is $0.85 per label including overhead, the savings per label is $0.70 before accounting for reduced QA. At 500,000 labels per year, that's a $350,000 gross saving before platform costs.
For monthly platform fee pricing, annualize the platform cost and compare against the annual labor savings. A $399 per month platform with 500,000 label capacity costs $4,788 per year. If the pre-labeling saves 65% of annotation labor hours on 500,000 labels, and your blended annotator rate is $25 per hour with 20 labels per hour throughput, the labor saving is approximately $162,500. The ROI ratio is 34:1 before QA savings are included.
The time value of faster dataset releases
An ROI calculation that accounts only for direct labor savings undervalues pre-labeling because it ignores the time value of faster dataset completion. A model iteration that takes six weeks to produce a labeled training set has a different competitive trajectory than one that takes two weeks. In product domains where ML model accuracy directly affects customer retention, a four-week faster release cycle has revenue implications that exceed the annotation labor savings.
Quantifying this requires knowing your average revenue per model iteration improvement, which most teams don't track precisely. A reasonable proxy is: how much engineering time is blocked waiting for the labeled dataset? An ML team of three engineers blocked for four weeks is 480 person-hours of fully-loaded engineering time, typically $60,000 to $100,000 depending on compensation. Reducing that block time is a real cost saving even before counting annotator hours.
Building the business case for annotation infrastructure
The most effective structure for annotation infrastructure proposals is a three-year model. Year one typically shows break-even or modest ROI as the team adapts workflows and the pre-labeler calibrates to the domain. Year two and three show compound ROI as the team produces multiple dataset iterations with an increasingly accurate pre-labeler that reduces correction time further each cycle.
The case is strengthened by including a current-state baseline measurement, not an estimate. Instrument your existing workflow for one annotation batch: record hours per frame, QA rejection rate, and rework hours. Those numbers become the anchor for the before/after comparison and make the ROI projection significantly more credible to stakeholders who have seen annotation cost estimates miss their targets before.
Calculate your annotation ROI